- Defined the source tables that form the basis of our data model.
- Created staging tables to clean and standardize the data.
- Built fact and dimension tables to model the data.
Models Built
Core Models
Core models are the facts and dimensions that form the core of our data model. They are the building blocks of our data warehouse. These models can be connected directly to your BI tool for reporting and analysis. Certain tools like Looker, Lightdash etc. allow you to define relationships between these models to create a semantic layer and enable self-service analytics for your end users. These models can also be exposed directly to your data analysts for ad-hoc querying, or aggregated into a mart layer to serve specific business use cases.Facts
We have created the following fact tables:fct_orders- Contains information about the orders placed by users.fct_order_items- Contains information about the items in each order.
Dimensions
We have created the following dimension tables:dim_users_history- Contains historical information about users.dim_items_history- Contains historical information about items.dim_merchants_history- Contains historical information about merchants.dim_promotions_history- Contains historical information about promotions.
Entity Relationship Diagram
Here is an entity relationship diagram (ERD) of the data model we have built: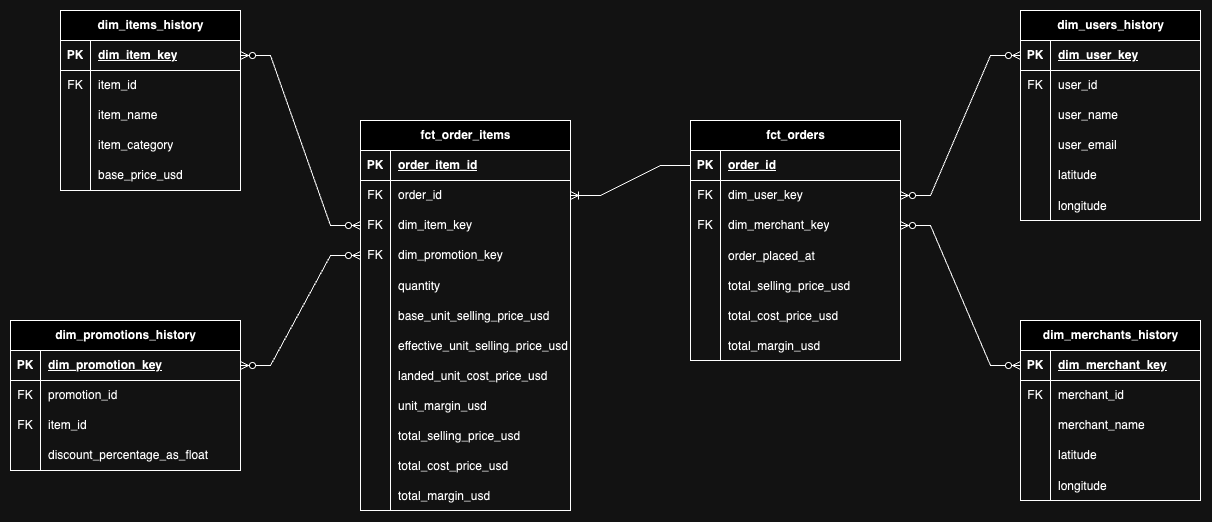
Staging, Snapshots, and Intermediate Models
We have also created staging tables to clean and standardize the data, snapshots to track changes over time, and intermediate models to store the results of different stages of the ETL process. These models are not directly exposed to end users but are used internally to transform and prepare the data for analysis. Ideally, they should be stored in a separate schema or database from the core models to keep the data warehouse organized and maintainable.Mart Layer
As we mentioned above, sometimes it is useful to aggregate data from our core models into a mart layer to serve specific business use cases. Some reasons to create a mart layer include:- Business logic: Help simplify complex business logic or provide a more business-friendly view of the data.
- Reverse ETL: Prepare data for reverse ETL processes that sync data back to operational systems.
- Machine Learning: Prepare data for machine learning models or other advanced analytics.
- Performance optimization: Aggregating data can improve query performance.
mart_gmv_by_merchant_and_category_daily
Specification
We would like ourmart_gmv_by_merchant_and_category_daily table to have the following columns:
| Column Name | Type | Description |
|---|---|---|
| report_date | date | Date of the transaction |
| merchant_name | varchar | ID of the merchant |
| category | varchar | Category of the item |
| gmv | float | Gross Merchandise Value |
| margin | float | Margin percentage |
Model
The following dbt model creates a mart table that reports daily GMV and margin metrics, aggregated by merchant and item category.Epilogue
This concludes our data modeling exercise using dbt. We have successfully built a data model for an e-commerce database, including core models, staging tables, snapshots, intermediate models, and a mart layer.The Kimball Group’s approach to data warehousing is a widely used methodology for designing data warehouses.
Their website contains a wealth of information on data warehousing concepts and best practices.If you’re interested in learning more about data warehousing, I highly recommend checking out their
online resources.